A P-D-C-A APPROACH IN RELIABILITY IMPROVEMENT

Babu Paul, Director BRiQ MSS

  1. That was the day of Management Review Meeting at a premier fighter aircraft overhaul depot of Indian Air Force. April is the time we do the “post-mortem” after the hectic production year completion.
  2. Chief of Aircraft (CA) was in his analytical best. He leaned on the back of his revolving chair and started. “Reliability of the Avionic aggregates has gone down drastically. It is evident from the customer
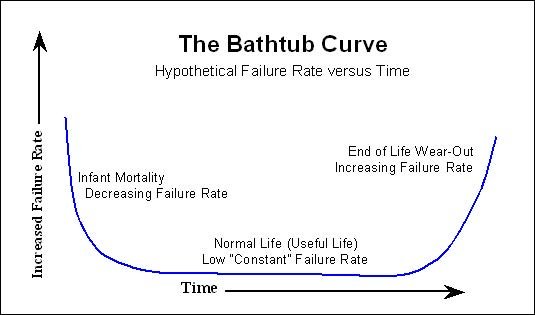
    feedback (understand as panic calls from operating squadrons for items) which I keep getting throughout the day. Also, look at your increased Premature Withdrawal Rate (PWR). The Average Service Life (ASL) of many reparable are less than 50% of the To Be Overhauled (TBO) life of 1000 Hrs of flying. We cannot go on like this. Pull up your socks and get to the bottom of this issue. I need a road map in next ten days”. He was in his no nonsense posture. Good sense prevailed, we kept quit and did not give the standard excuses of infant mortality, substandard packing for transportation, extreme weather at operational bases, aging fleet and poor operational and maintenance practices at operating units.
  3. I was working as a Production Engineer(PE) in the Avionics Reparable Servicing Division. My colleague had rich experience in The type aircraft maintenance and overhaul. After CA’s “Moral Lecture (ML)” we came back to the Division and sat down for brain storming. The Quality Circle of the Division was asked to study and propose an Action Plan. We decided that the division should proceed with a Process Improvement Programme through PDCA cycle.
  4. W.E. Deming the celebrated Quality Guru adapted the Shewhart Cycle into PDCA cycle. A PDCA cycle is used frequently in Quality Management Systems (QMS). PDCA is briefly described in IS/ISO 9001:2008 Standard as follows:

    Plan: establish the objectives and processes necessary to deliver results in accordance with customer requirements and the organization’s policies;
    Do: implement the processes;
    Check: monitor and measure processes and product against policies, objectives and requirements for the product and report the results;
    Act: take actions to continually improve process performance.


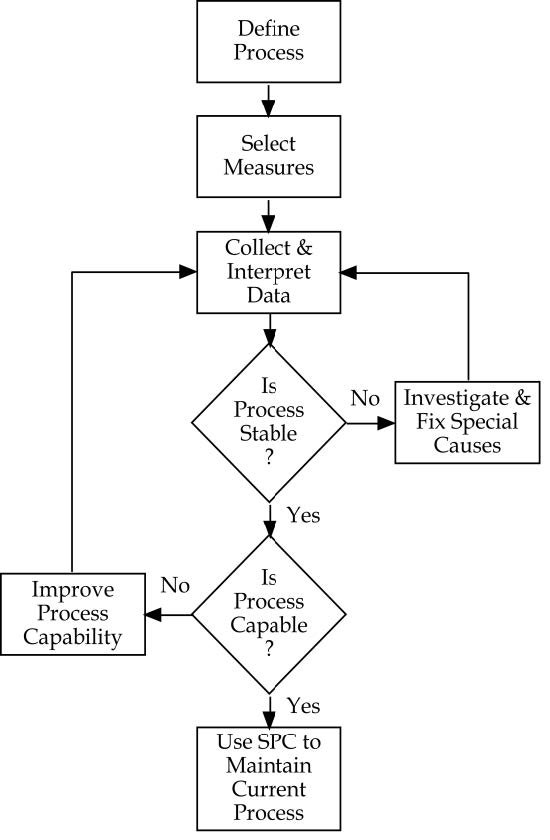
  5. During each phase of this continual improvement program the Key Result Areas or Objectives have to be defined in advance. The diagram below depicts the KRAs in each phase of PDCA.
  6. The Process The process of aggregate repair/Overhaul comprises of stages specified in the Work Packages. The avionic reparable (also termed as rotable or aggregate) are send for repair/overhaul on completing the TBO hours to the Avionics Reparable Servicing Division. On receipt, the item undergoes following stages of process during overhaul/repair:


  7. The Problem The specific problem of failure prior to completion of the assigned useful life after repair/OH for 25 unique lines of avionic reparables of The fleet were at an alarming rate (High Failure Rate Aggregates, HFRA). This was not up to the reputation of the division. Also it amounted to, reducing the fleet serviceability and compromising the operational preparedness of squadrons, extra working hours put in by technicians at BRD/units and loss to exchequer due to additional expenditure on spares, consumables, transportation and time.
  8. First Cycle of PDCA Following were the stages of first cycle of PDCA:-
    (a) Plan Brain storming was conducted by the Quality Circle of the Division. A road map was charted as follows:-

    (i) Collect Failure Data of reparable for last five years.
    (ii) Collect repair details of all failed repairable.
    (iii) Identify the High Failure Rate Aggregates (HFRA) as per the criteria given in Air HQ letter on the topic.
    (iv) Prepare Defect Trend Analysis of each of the HFRAs.
    (v) Research for Reliability Improvement by eliminating the causes of failure through Reliability and Maintainability (R&M) study for the HFRA.

    (b) Do As planned, the Division accomplished the following in Do Phase:-

    (i) The failure data of last five years were collected from QA Department.
    (ii) Repair data was collected from all production Labs of the Division.
    (iii) Aggregates with low Mean Time Between Failure (MTBF) or Average Service Life (ASL) were identified as High Failure Rate Aggregates (HFRA). Few of the identified ones are Flight Data Recorder (FDR), Auto Pilot Computer, Fuel Computer, Helmet Mounted Target Designation System (HMTDS), Limit Control Unit of Engine System, Radar System and V/UHF Radio System.

    (iv) Defect Trend Analysis of the HFRAs revealed the following vital few among the trivial many:-

    (aa) Failure of OLD Capacitors (14 to 17 years old electrolytic capacitors) amounted to approximately 43% of failure (ageing and value change due to degradation).
    (ab) Failure of PCBs due to overheating amounted to 12% of failures. Insufficient cooling was suspected.
    (ac) Inaccurate voltage inputs were measured in cases where discrete components of PCBs were fount burnt ( 8% of total failures).
    (ad) Remaining failures were either random or not confirmed in the Labs.

    (v) The Defect Trend Analysis (DTA), R&M studies and research led to charting a Reliability Improvement Programme for each of the 25 types of reparable. The salient aspects are listed below:-

    (aa) OEMs have been upgrading the Radar by replacing the OLD Capacitors with new advanced capacitors.
    (ab) Sufficient stock of new capacitors were available in the Division Logistic stores with all ranges of required capacitance and sizes. .
    (ac) One to one replacement as per capacitance and sizes for fitment space were proposed by the division and agreed to by Local Technology Committee (LTC) of the depot who oversees modifications. The complex cases were forwarded to Regional Certification Authority for Military Aircraft (RCMA) for approval.
    (ad) For few items perforations as cooling vents were put on the body of the metallic cover and adding miniature DC fans were proposed to enhance cooling.
    (ae) Voltage tapping changes were possible as multiple output options are given in the OEMn Transformers. This ensured correct voltage levels at PCB inputs.

    (c) Check On approval of the Reliability Improvement Programme from LTC the efficacy of the programme was to be checked thoroughly by following the listed steps:-

    (i) Two prototype each were prepared with the modifications incorporated.
    (ii) Burn through checks by 50 Hrs Lab operation including four Hrs continuous operation per day were performed and all parameters were measured during various instances during the day.
    (iii) Reliability Improvement Plan along with test results were put up for clearance for flight trials from Regional Director of RCMA.
    (iv) On approval, flight trials for two sorties were carried out.
    (v) Items were withdrawn and all parameters were checked for consistency and was found to be within limits.

    (d) Act On successful lab checks and flight trials the items were send for field trials for 50 Hrs of operational flying on aircraft. Proto type one each was send to a different operational base to ensure stability in environment conditions. The field units were instructed to return the items to the repair division if successful operation has been accomplished or as soon as a failure occurs. This was fulfilled during 2005-06 for 25 different aggregates and the number of cases of failure occurred in the modified reparable were negligible. The cases of failure were minutely analysed to see the cause of failure to rule out repetitive failure or modification as the reason for the snag.

  9. Second Cycle of PDCA. Following was the sequence of second PDCA:-
    (a) Plan On successful first PDCA cycle, the Division embarked on the second cycle. The Plan phase comprised of:-

    (i) Planning for provision of spares, components and consumables.
    (ii) Formulation of training schedule for technicians after dovetailing the modifications and standardising the Work Packages.
    (iii) Survey of repairable held (serviceable and faulty) in field units, Base Logistics and Repair Depot.
    (iv) Plan to cater to increased production by extra working hours and pooling of man power.

    (b) Do The do phase implemented the actions envisaged in plan phase and the production was staggered to meet the task, field unit demand etc.
    (c) Check Regular data analysis (once in a quarter) has been accomplished to check the fleet serviceability and increase in Average Service Life (ASL) and Mean Time Between Failure (MTBF) of each reparable as the % of reparable upgraded were increasing. A positive improvement was recorded as the failure rate reduced by 50% within one year of starting the fleet up gradation programme and 30% of the assets in the fleet were up graded.
    (d) Act In the act phase the complete fleet up gradation was to be ensured and the reliability of the up gradation programme evaluated by correlating with the failure data. No unusual spike observed in any case. Steady reduction in failure pattern was observed.

  10. Next Cycles of PDCA The goals of the subsequent PDCA cycles were as follows:-

    (a) To evaluate the reliability of modified reparable after three to four years and five to seven years of modification. On an average a reparable is returned to overhaul Division after seven years for overhaul if no failure happens during this period. Parameters of vintage Capacitors, efficiency of DC fans and health of transformers were to be checked.
    (b) To find new vital few of freshly identified HFRAs for the quarter by following similar paths as in first and second cycle of PDCA.
    (c) If any modified aggregate continues as HFRA, new vital few are to be identified for further improvement. Only one item was coming under this category.

  11. Benefits of PDCA study. The benefits are as follows:-
    (a) The approach provided a systematic methodology for process improvement of Reliability Improvement of Avionics Reparable of the aircraft.
    (b) Morale and team spirit improved and the team was ready to take up new projects.
    (c) Serviceability of fleet increased within two years of starting the project.
    (d) Multiple critical demands on a single item was minimal (2 to 3 only). Priority demands reduced by 40%.
    (e) By ensuring better serviceability of aircraft at field units with reliable components, the image of the Reparable Servicing Division and Depot was enhanced in the whole of Indian Air Force.
    (f) The confidence level of technicians, supervisors and middle managers has improved with this approach and accelerated the process of Lean Manufacture. The PDCA is the step towards Six Sigma as DEMAIC follows the similar philosophy.
    (g) The division was awarded Best Quality Circle during the Year for successful initiative.

  12. All is well ! In the Jelebi, Samosa & Chai Party, Chief Production Engineer was proud to call the CA (a new one of course as the Group Captains gets posted out faster in IAF) as a guest and the CA was lavish in praising the good work done by the Avionics Reparable Servicing Division.

    (The article was published in Naval Aircraft Quality Assurance Journal)

TAKING THE INTERNAL QUALITY AUDIT PROCESS A STEP FURTHER

Sushil Bhatia, Director BRiQ MSS

In a conventional set up of an organization, (service or manufacturing), the quality audits are employed as a tool to find gaps between what/how needs to be done and what/how it is being done. Of course, the relations between the inputs, outputs, resources etc have already been defined.

As defined in” ISO 19011:2011—Guidelines for Auditing Management Systems”, an audit is a “systematic, independent and documented process for obtaining audit evidence [records, statements of fact or other information which are relevant and verifiable] and evaluating it objectively to determine the extent to which the audit criteria [set of policies, procedures or requirements] are fulfilled.” Several audit methods may be employed to achieve the audit purpose.


When Quality Audit Systems are utilized for internal audit purpose, they can be categorized under First Party Audit. In this case, the audit outcomes are considered as important information for the top management regarding the extent to which the policies and procedures are being complied with within the company, and also any issues which require facilitation by management for allocation of resources, policy decisions etc.


Today, the organizations are looking at optimum utilization of resources, as right kind of resources are becoming increasingly scarce and costly, if not precious. At times, the definition of the resource itself becomes the USP of an organization. For example, in the field of civil aviation, the companies have coined the word “On Time Performance: OTP” to gauge their performance.


Given the actual scenario of an internal quality audit, most of the time, the companies restrict the scope of audits to gauge mere compliance/ conformance to policies and procedures. Let’s get to the basics of it. An auditor unearths the so called “gap” in a process during an internal audit. In that, he finds that instead of raw material A, the process is using material B, which is not complying with the procedures, and hence the auditor records it as a gap. The question is “why this gap between A and B” is to be unearthed by Auditor, and could not be unearthed by the process owner himself? Is it by chance or by default?


I fully endorse the principle that the role of independent Audit Department cannot be dispensed away with in any organization. However, the question is about the nature of gaps and quantity. Agreed that a newly incepted organization would have lots of gaps in the beginning, but should mature after some time. After it has stabilized, however, do you actually require an “outsider” to tell you where the gap in your procedure is? To my view, a process

owner is supposed to be master of his field of work. In this context, I would say that an auditor is being utilized to unearth what that process owner is not doing what he is supposed to do.


Now, here is the dichotomy. Organization practices optimum utilization of resources and approves of multi-tasking. However, in this context, I would say, once “mundane” under control, synergies of the auditor can be diverted to value addition work.

PERFORMANCE Vs COMPLIANCE/CONFORMANCE

The compliance/conformance to the regulators’ requirements and company policies is in no way less important, especially in the world of civil aviation, where the companies have to comply with international laws also, apart from domestic ones. However, in current times, the purpose of these audits must go beyond traditional compliance and conformance audits. The audits that determine compliance and conformance are not focused on good or poor performance. An organization may be in compliance with all policies and procedures, but may be a poor performer when we talk in organizational context.


In view of the above, it is mandatory that all process owners be held more responsible towards number of gaps that they leave in their processes, to be discovered later by auditors. This way, the auditors would have more resources to divert to more value-adding activity, rather than encountering “mundane” gaps aplenty, which can be tackled by careful process owners.

EMPOWERMENT OF QUALITY TEAM


No organization can progress far without investing into the human resources. An auditor needs to be trained in correct auditing techniques, and needs to be groomed by the experienced Lead Auditor to see “through” the things during audit. In a similar manner, to do a performance audit, the team needs to be properly and adequately trained in the quality tools.
A good organization utilizes a combination of quality tools at appropriate occasions. The team needs to be encouraged to think quality, and all resources, including quality journals; books etc need to be adequately made available. The team needs to be trained in tools, like Kaizen, 5S, Six Sigma, Lean etc.

HANDS ON PROJECTS


Almost none of the institutes offer real world hands-on projects to the participants. In this scenario, the organization must have a project in mind, while building up the quality teams, so that principles learnt in theory can be practiced in the organization itself. In fact, it would be continuous exercise on the part of the company to build up the skills in the hierarchy. For example, in case of Six Sigma, the company would have many green and yellow belts, few Black belts, under Master BB and a mentor.

(THIS ARTICLE WAS PUBLISHED BY AUTHOR IN THE QUARTERLY MAGAZINE “QUALITY INDIA” PUBLISHED BY QCI, IN THEIR MAR 2018 EDITION)

RISK MANAGEMENT IN OPERATIONS

Sushil Bhatia, Director BRiQ MSS

Risk Management is the identification, analysis and elimination (and/or mitigation to an acceptable OR tolerable level) of those hazards, as well as subsequent risks, that threaten the viability of an organization. (ICAO DOC 9859).


The term operational risk management (ORM) is defined as a continual cyclic process which includes risk assessment, risk decision making, and implementation of risk controls, which results in acceptance, mitigation, or avoidance of risk. ORM is the oversight of operational risk, including the risk of loss resulting from inadequate or failed internal processes and systems; human factors; or external events.


The objective of Risk Management is to ensure that the risks associated with hazards to operations are systematically and formally identified, assessed, and managed within acceptable safety levels.
And the next logical question is “what are the acceptable safety levels?”
Let us understand it this way. A worker has to cycle down 4 kms to go to the work site of a company. On the way, he has to negotiate broken roads, pass through a thick forest for 500 m, which is known to have a panther. Also, there is no repair shop on the way. Now, the worker has two options. He does not go and loses the job, and perish. Or he goes and faces the risk of falling down; breaking his bones, or getting killed by panther, etc. Actually, he cannot risk any of the options in the present form. So he decides to continue with the job. To minimize the risk of getting hurt by falling down while cycling, he decides to use helmet and knee guards. To ward off the carnivore, he decides to use a siren for that 500 m stretch. He also decides to keep a small tool box handy, in case his cycle happens to break down.
The situation of any company is something similar. Take for example a civil aviation carrier. The company faces risks right from the time of inception. What type of aero planes to fly? How much maintenance staff? What capability? Training status? Ticket pricing? Sectors to be served? Full service or low-cost? Pay packages to employees? What all to outsource? And so on.


The complete elimination of risk in any organization is obviously an unachievable and impractical goal. Being perfectly safe would amount to stopping all operations. But then why the company should come into existence at first place? Also, not all risks can be removed or mitigated to perfection, as it may become too uneconomically viable. Hence, this is taken for granted that during operations, there will be some risks which have to be accepted. So how much is “acceptable” risk? This is called “MANAGEMENT’S DILEMA”.

So, how do you define the acceptable levels of risk? It is defined by the term “AS LOW AS REASONABLY PRACTICABLE (ALARP)”. The ALARP principle is that after the risk mitigation, the residual risk is at a level which is acceptable to regulators and management, in the interest of all stake holders.


Thus, given the scenario, the organisation is expected to operate between the thin band of Safety Space, with Bankruptcy and Catastrophe as extreme values, as shown below.

It is pertinent to note that of late, all standards, whether we talk of ISO or AS, have introduced the clauses of Risk Management, to be complied with.
The risk can be considered having two factors:


(a) Probability (P) that the event will occur
(b) Severity (S) of the outcome, if the event occurs.


The factor P can be divided into a scale of 5 as (Frequent=5, occasional=4, remote=3, improbable=2 and highly improbable=1) and Severity S as (Catastrophic=A, hazardous=B, major=C, minor=D and negligible=E).
The multiplication of P and S gives us the Risk Index (RI). Now, each organisation needs to decide, in their situation, what values of RI are acceptable without mitigation, what values acceptable with mitigation and what values of RI as “no go” situations.

Thus, a Risk Matrix can be drawn for ease of understanding and working out various levels, as given below.

RISK PROBABILITY RISK SEVERITY
Catastrophic
A
Hazardous
B
Major
C
Minor
D
Negligible
E
5 – Frequent 5A 5B 5C 5D 5E
4 – Occasional 4A 4B 4C 4D 4E
3 – Remote 3A 3B 3C 3D 3E
2 – Improbable 2A 2B 2C 2D 2E
1–Extremely Improbable 1A 1B 1C 1D 1E

While referring to the Table above, suggested levels of acceptable risks are shaded in Red, Blue and Green, with following suggested interpretations:

Sl No RISK INDEX REMARKS
1 5A, 5B, 5C, 4A, 4B NO GO situation. Mitigation to be taken by top management.
2 4C, 4D, 4E, 3A, 3B, 3C, 3D, 2A, 2B, 2C Acceptable, with mitigation actions.
3 3E, 2C, 2D, 2E, 1B, 1C, 1D, 1E ACCEPTABLE

The RI can be reduced by one of these:


(a) Reducing the Probability (P)
(b) Reducing the Severity (S)
(c) Or by reducing both P and S


For example, in case of the worker cycling to work, whereas probability of fall on bad roads may not be in his control, he is trying to control the severity of fall by wearing helmet and knee guards. Whereas helmet and knee guards may also reduce the severity of the panther attack, he is trying to reduce the probability of attack by loud horn.


This is important to remember that risk management needs to be done for each department, including each process, and records thereof need to be kept for future reference. Also, each process may have to be revisited in terms of Risk Management at regular intervals, depending on any changes introduced.

QUALITY … A PILGRIMAGE TO PERFECTION

Babu Paul, Director BRiQ MSS

” Om.. Asato Maa Sad-Gamaya
Tamaso Maa Jyotir-Gamaya
Mrtyor-Maa Amrtam Gamaya
Om Shaantih Shaantih Shaantih (1)”

– Upanishad

A prelude

When I was functioning as Chief of Quality in in an Air Force Overhaul Division, I decided to pen down an article on my view of “Quality Assurance” some day. I start this sojourn with a prayer on my lips. “Oh God… give me strength. Lead me from darkness to light. From ignorance to knowledge.”

Quality in everyday life

We all have different views about Quality. Quality Gurus taught us that it is

  • Conformance to specifications.
  • The degree to which a product or service meets the needs of the customer.
  • Uniformity around a customer defined target.
  • Exceeding customer expectations.

I agree to all of them. I am sure you also would agree to these definitions. Then … why does our Reparable, Systems and aircraft fail in the operational units after we do the overhaul or repair?. Why do we face Production Hold Ups(PHUs)?.

Be the God of your Quality

I titled this article as ” A pilgrimage to perfection”. A pilgrimage is a journey or search of moral or spiritual significance. Here… I want it to be a metaphorical journey in to our own beliefs. A belief that ” I am the one who assure the Quality of my work. I will leave no stone unturned and I defy all limitations imposed on me. I shall be the god of my action”. Thus, be the true believer of advaitham, a Malayalam word for non duality. A faith that the abode of god is within the mortal self.

When I was interacting with the young technicians of my division, I often used to tell them that Quality Assurance can only be complete when we have no Quality Assurance Section(QAS) staff to police their actions. QAS inspectors often have limited knowledge and lesser skill level than the technician who works on a test bench producing a limited range of products. Then, where is the question that QAS assures your quality. “Quality needs to be assured by each individual who adds on to the value chain. A logistician who procures the spare, the administrative staff who provides the optimal environment, the top management who ensure your morale and the technician who perfected the art. Like Lord Vishvakarma the architect of the universe, you would strive for Quality in your work.

Journey to the Abode

Quality does not happen as serendipity, “a happy accident” or “a pleasant surprise”. Each element needs to follow “Plan-Do-Check-Act” (PDCA) Cycle . So… what do we do?

  • We learn what we have to learn. This is a continuous process.
  • We do it again and again till we reach perfection when we are confident to assure the Quality of our own work. After that we would achieve six sigma and much more.
  • We reach out to others who can provide us help, guidance and wherewithal.

We decide our destiny. Each day must be an incremental improvement from previous day. A continual improvement of our process which would culminate to better product and higher customer delight.

Failure is an opportunity, not the end of the road

A young Corporal of my depot once asked me in my Lean Management lecture. “Sir,… When a reparable fails during Functional Test(FT), Is it not a waste…?”. I said “Yes…waste of rework as listed in seven types of wastes . And no, since it is a great opportunity to obtain inputs to perfect your process and improve the product”.

Reliability of a product

  • The first part is a decreasing failure rate, known as early failures.
  • The second part is a constant failure rate known as random failures.
  • The third part is an increasing failure rate known as wear out failure.

The important information of failure data during all three phases are so vital that it cannot be ignored. The inputs we receive from field units through Defect Reports (DRs), Premature Withdrawal Reports (PWRs) and complaints/feedbacks are valuable data to study Defect Trends. Defect Trend Analysis (DTA) is our first step in Reliability & Maintainability (R&M) studies which would give insight to improve the quality of our products.

Every individual with professional pride, ego and faith in self have to embark on the path of discovering what is causing failure after his accomplishment of task. I cannot chart a path for you. You have to find it out yourself. A guiding model is provided to you in the flow diagram of Quality Improvement Model .

The purpose of the road map is to provide a sequence of steps to improve your process so that our customers would benefit the highest quality and value. Your steps are

  • Defining the process.
  • Selection, measurement, collection & interpretation of data.
  • For a process found not stable investigate the root causes and fix them.
  • For a stable process check to see the process capability. Improve it if found not satisfactory.
  • For a stable and capable process use Statistical Process Control(SPC) to maintain the current process.

A faith redefined

Quality should be a junoon for you, an obsession… a faith. It would redefine the world around you. Your quest for improving your own standard each day through collecting the failure data and analysing the Failure trend is the first step to be taken. Improve your process with the knowledge acquired from the DTA, customer feedback and Original Equipment Manufacturer (OEM) manuals. An improved process would improve the quality of product and Quality of Work Life (QWL). This is certainly going to delight the end users. So what are you waiting for?. Without delay, embark on your Pilgrimage to Perfection.

(1)
Translation of sanskrit poem Asatoma….

Om… Lead us from unreality of Transitory existence to the reality of self.
Lead us from darkness of ignorance to the light of spiritual knowledge.
Lead us from the fear of death to the knowledge of immortality.
Om Shanti….Peace….Peace.

(Article was published in IAF Maintenance Journal)